Evaluation

Using Research Evidence to Predict and Optimise Therapeutic Benefit: A Multilayered Approach

How can we use research data to inform and improve therapeutic practice? When I wrote my book Essential research findings in counselling and psychotherapy (Sage, 2008), I did what most writers in the field had done: I tried to organise and make sense the evidence by different ‘factors’. I used the usual suspects: client factors (e.g., the client’s motivation); therapist factors (e.g., the therapist’s gender); relationship factors (e.g., the amount of goal agreement); technique and practice factors (e.g., using two-chair work); and orientation factors (e.g., working in a person-centred way). That gave a fairly simple and clear taxonomy and meant that it was possible to describe the relative contribution of different factors to therapeutic outcomes. For instance, one might estimate, based on the most recent evidence, that approximately 40% of variance in outcomes is due to client factors; 30% due to the relationship; 15% to therapist factors; and 15% due to the particular techniques, practices, or orientation used. This can then be neatly depicted in a pie chart, like Figure 1.

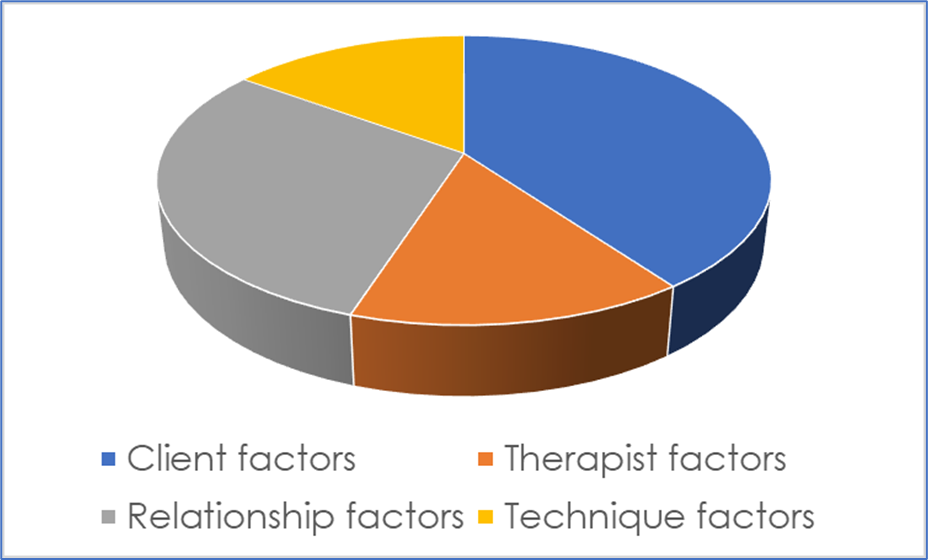
Figure 1. Illustrating the Contribution of Different Factors to Therapeutic Change

Despite its clarity, organising research evidence in this way has its limitations. One very obvious one is that it implies that each of these factors is discrete when, of course, they are likely to inter-relate to others in complex, mutually reinforcing ways. Another problem, more directly related to the framework developed in this article, is that they tend to infer that each client is influenced by each of these factors in the same way and to the same extent: that relationship factors such as empathy, for instance, lead to 30% of outcomes for Client A, and also for Clients B, C, and D. The reality, however, is that Client A may do very well with empathy while Client B may not; and while relationship factors may be essential to Client C’s recovery, Client D may do very well without them. Indeed, much of the cutting edge research in the psychotherapy field—by leading figures such as Zachary Cohen and Jaime Delgadillo—is on the particular factors that lead particular clients to do particularly well in particular therapies; and the algorithms that can then be developed, based on such evidence, to optimise benefit. Organising the evidence by factors may also limit its utility for therapists. As practitioners, we do not tend to think about our work, systematically, in terms of these different factors (e.g., ‘What can I do to improve myself as a therapist?’ ‘What can I do to improve my relationship?’); and it is also important to note that different factors may have very different implications for practice. Knowing, for instance, that clients with secure attachments do better in therapy than those with insecure attachments (a client factor) does not really tell us anything about how to work; while knowing that clients tend do better when their therapists are warm and genuine can have important implications for practice. So although these factors, in Wittgenstein-ian terms, have a ‘family resemblance’, they are actually quite distinctive things.

The aim of this article, then, is to describe a way of organising and conceptualising therapy research evidence that addresses some of these problems: allowing for a more nuanced, comprehensive, and personalised conceptualisation of data; and potentially more useable by therapists. The essence of this framework is a pyramid (or funnel, see Figure 2), with different layers of evidence at increasing degrees of specificity and proximity to the client. Each layer builds on the previous ones: from research evidence that is relevant to all clients to research evidence that is specific to a particular client in a particular session. As this pyramidal form suggests, as we move upwards, evidence may become more sparse. However, because of its greater specificity, and because it is most proximal to clients’ actual experiences—such evidence may be of greatest value. For instance, research suggests that clients generally do better when therapists are empathic (Layer 2), but if evidence exists that the opposite is true for highly paranoid clients (Layer 3), then the latter finding would tend to take precedence to guide practice with a highly paranoid client. However, if it was then established that, for a particular highly paranoid client, they had a strong preference for an empathic therapist (Layer 4), then this higher-layer evidence would take precedence over the group-specific (Layer 3) finding.

Figure 2. A Pyramidal Framework for Organising Therapy Research Evidence

The foundation of the pyramid, Layer 1, is general evidence on client and extra-therapeutic factors that tend to determine good outcomes. For instance, clients who are psychologically-minded tend to do better in therapy, as do clients with more social support. These factors are separated off from other factors (depicted in Figure 2 by a dividing line), because they are less relevant to what therapists do. Rather, they are the grounding—to a great extent outside of the therapist’s control—as to how therapy is likely to proceed. In this respect, these general factors have an important role in predicting outcomes—and, indeed, may explain by far the largest proportion of variance—but do not have much role, per se, in informing or shaping how therapists work.

Note, the term ‘tend to’ indicates that, while these findings are drawn from generally representative samples (or samples assumed to be generally representative), this is not to suggest that these factors will be true for each and every client. Rather, this is evidence, across all clients, of averaged tendencies, around which there will always be considerable group-, individual-, and session-layer variance.

Building on these general client and extra-therapeutic factors are general factors that are related to the therapist and their therapy (Layer 2). This includes therapist factors (for instance, therapist gender), relationship factors (for instance, the alliance), and technique factors (for instance, use of cognitive restructuring). These are findings that reach across all clients and, although still averaged trends, can be very useful for therapists to know. In the absence of any other information, they provide a useful starting point for work: for instance, be empathic, listen, or self-disclose to a moderate extent.

At a greater layer of specificity (Layer 3) is evidence of particular factors that tend to be associated with helpfulness for particular groups of clients. By far the greatest amount of evidence here focuses on clients grouped by particular mental health diagnoses—for instance moderate depression or obsessive-compulsive disorder—as reviewed and operationalised, for instance, in National Institute of Health and Clinical Excellence (NICE) guidelines. Considerable research is also now available on clients with particular cultural identities (e.g., people of colour, lesbian clients), and what tends to be most effective for them. There is also a wide range of research on other ‘aptitude–treatment interactions’ which identifies the factors that tend to be most effective with particular groups of clients. For instance, clients who are more reactive tend to do better in less directive therapies, while the reverse is true for clients who are more compliant. Of course, clients may be members of multiple groups—‘intersectionality’—such that practices indicated may be complex or, potentially, contradictory. Tailoring therapies to particular client characteristics is what Barkham terms ‘precision therapy’, linked to the wider development of ‘precision medicine’: ‘predicting which treatment and prevention strategies will work best for a particular patient’ (NHS England).

Moving up in specificity, to Layers 4 and 5, entails a shift towards individual-level research and data gathering (Figure 3). This is, perhaps, the most important and novel part of the framework being suggested here, because a continuum is being proposed from (a) general- and group-level research to (b) contemporary, individual-level monitoring: one segues into the other. In other words, the framework suggests that what researchers do ‘in the field’ is not so different from what therapists do when they are working with individual clients using routine outcome monitoring (ROM): it is all part of one broad spectrum of using data to help inform practice. This may be helpful for practice because it de-mystifies ‘research’ and puts it on a equal footing with things that a practitioner would typically do. Now, research about populations or groups is not something that researchers do far away on some other planet, but is an extension (broader, but less specific and proximal) of what therapists are, actually, doing all the time. That does not mean it can be waived away, but it does mean that it can be considered a friend rather than enemy (‘the facts are friendly’, as Carl Rogers said).

Describing individual-level data gathering as ‘research’ is a somewhat unusual extension of the term. Almost by definition, ‘research’ is seen as involving generalising from specific individuals to the wider group or population. However, if research is defined as ‘a detailed study of a subject, especially in order to discover (new) information or reach a (new) understanding’ (Cambridge Dictionary), then generalisations can also be at the individual client layer: from, for instance, one session to another, or from assessment to across the course of therapy as a whole. Individual-layer research like this is not something you would see published in a journal, nor could it be summarised in a book like Essential research findings. Even with individual-focused research methods like autoethnography or heuristic research, the aim is to reach new understandings that are of relevance across clients or contexts. But with the individual client-layer research described here, the aim is solely to use data to reach new understandings about this individual client. It is a form of systematic enquiry which the therapist, themselves, does, to help optimise their therapeutic work with the client by drawing on data.  

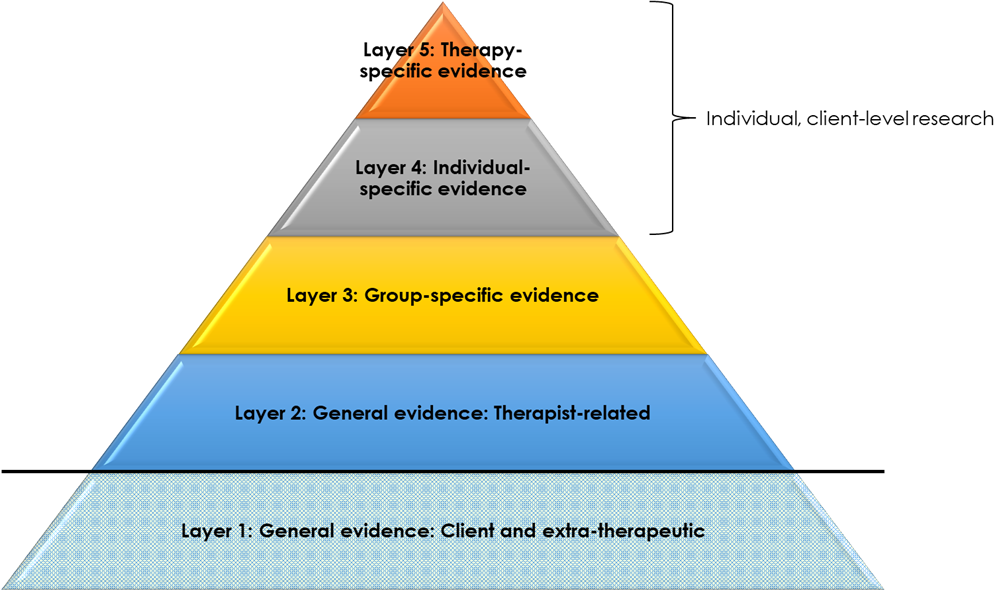
Figure 3. Individual Level Research

Layer 4, like Layer 3, entails the use of data, prior to the commencement of therapy, to estimate what is most likely to be helpful for a client. While Layer 3, however, makes such assumptions on the basis of group characteristics, Layer 4 focuses exclusively on that client’s individual uniqueness. This is the complex, rich mixture of characteristics and experiences that make the person who they are: irreducible to any particular set, or combination, of group characteristics. In terms of system theory, this is their ‘emergent properties’; in terms of the philosopher Emmanuel Levinas, their ‘otherness’. Understanding how data at this layer may be captured and integrated into therapy is, perhaps, the least well-developed element of this framework. However, one notable and well-researched element here is the client’s preferences: recorded, for instance, on our Cooper–Norcross Inventory of Preferences (C-NIP) at assessment. The focus of such individual layer research, then, is on what this specific client needs and wants from therapy; and the incorporation of such findings into the therapeutic process.

Finally, at the highest layer of specificity (Layer 5), is the use of data to guide the ongoing process of therapy, as in the well-researched and -developed practice of routine outcome monitoring (ROM). In ROM, the therapists uses data from ‘outcome forms’ (like the CORE-10 or PHQ-9), and potentially also ‘process forms’ (like the Session Rating Scale), to track how the client is doing, and to try and adjust the therapy accordingly. For instance, if the client’s layers of symptoms are worsening, the therapist may draw on pre-specified ‘clinical support tools’, such as a protocol for reviewing the therapeutic alliance with the client. In this way, ROM can be considered research at the highest layer of specificity: generalising from data captured at particular points in therapy (for instance, at the start of each session), to the therapeutic work as a whole. Barkham terms this in-therapy, iterative uses of data as ‘personalisation’—distinct from the ‘precision’ tailoring of Layers 3 and 4.

Note, even at these highest layers of specificity, data still only ever gives indications of what might be of benefit to a client at a particular time, not what is. Client preferences, for instance, tell us what a particular client thinks will be helpful, but there are no guarantees that such practices are of benefit; ROM predicts when clients may most be ‘off track’, but there are still numerous sources of ‘error variance’ meaning that, in fact, some of these clients may be doing very well (what has been termed ‘paradoxical outcomes’). As we move up the layers, then, we may move from distal to proximal forms of evidence, less to more trustworthy, but even at the highest layer, we are only ever dealing with approximations. Hence, while higher layer data, where present, may deserve prioritisation, best practice may ultimately come through informing clinical work with data from across multiple layers.

In fact, Layer 5 is probably not the highest and most specific layer of data usage to optimise benefits in therapy. At every moment of the therapeutic work, therapists will be striving to attune therapeutic practices to what they perceive—consciously or unconsciously—as beneficial or hindering to clients. A client seems to become animated, for instance, by being asked about their brother, and the therapist enquires further; a client glances away when the therapist asks about the psychotherapy relationship and the therapist seeks another way of addressing the here-and-now relationship. Stiles refers to this as therapist ‘responsiveness’, and this is represented as a spinning circle right at the top of the pyramid (Figure 4). Bill Stiles, in a personal communication, has written:

Representing responsiveness research as a (spinning?) circle (wheel? ball?) at the top seems to me to convey both the recursive feedback idea (circle, spinning) and the potentially high specificity (possibly millisecond-scale, e.g., responsive adjustments in mid-sentence due to facial expressions).

These five layers of evidence, then, segue into the moment-by-moment, ‘evidence based’ adjustments that therapists are constantly making throughout their work. And, as the highest layer, such responsiveness may be most proximal and attuned to what clients will find most helpful. Nevertheless, in the absence of such proximal information, each of the preceding layers will give valuable information about where best to start with clients. Moreover, as suggested in the previous paragraph, given the vagaries and potential errors inherent in each layer of data (including responsiveness: for instance, the therapist may misread the client’s reaction, or the client may be hiding it through deference), it is probably a combination of evidence from across the layers that is likely to be most beneficial in successfully guiding therapy.

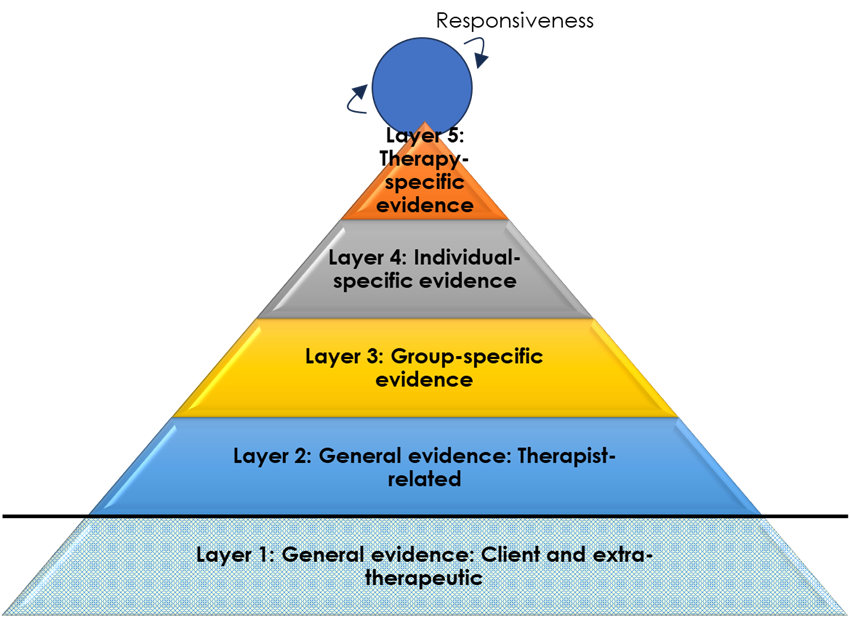
Figure 4. Layers of Evidence Segueing into In-Session Responsiveness

Although each of these layers of evidence have the potential to inform therapeutic practice, different individuals, training programmes, or services may place emphasis on very different layers. For instance, in the IAPT model (Improving Access to Psychological Therapies, now NHS talking therapies), based on NICE guidelines, practice is nearly-exclusively drawn from evidence at Layer 3 (in particular, diagnoses-specific evidence), with little consideration for other layers (see Figure 5). Even responsiveness to the needs and wants to the individual client, during IAPT practice, tends to be subsumed to manualised, ‘evidence-based’ guidance.

NHS/IAPT Emphasis on Diagnosis-Specific Evidence

On the other hand, in approaches like Scott Miller’s feedback-informed therapy, there is a particular reliance on the most proximal evidence: the client’s immediate feedback through ROM (Layer 5), as well as a responsiveness to the particular client in the particular moment (Figure 6).

Figure 6. Feedback-Informed Emphasis on Proximal Data

In contrast to Layer 1, Layers 2 to 5 provide opportunities for therapists to enhance their practice (Figure 7). This is in two respects. First, at a basic level, skills and competences can be developed in practices that have been shown to lead to beneficial outcomes. This is particularly Layer 2 general relationship factors (e.g., enhancing levels of empathy) and technique factors (e.g., developing skills in two-chair work). In addition, at a more meta-level, knowledge and competences can be developed in tailoring practices to group- (Layer 3), individual- (Layer 4), and therapy- (Layer 5) specific evidence. For instance, at Layer 5, trainees can be taught how to use ROM data to monitor and enhance therapeutic outcomes, particularly with ‘not on track’ clients. Such training may be based on informal guidance and feedback (e.g., through supervision) or, itself, may be evidence based: using data to feed back to trainees how they are doing on particular competences. A supervisor, for instance, might rate segments of their supervisee’s audio recordings, across multiple time points, on a practice adherence measure like the Person-Centred and Experiential Psychotherapy Rating Scale (PCEPS). This moves us into the realm of ‘deliberate practice’ and, indeed, a separate pyramid could be developed for the use of research in training: from the most general evidence about factors that improve practice to therapist-specific data on what an individual practitioner might do to improve their outcomes.

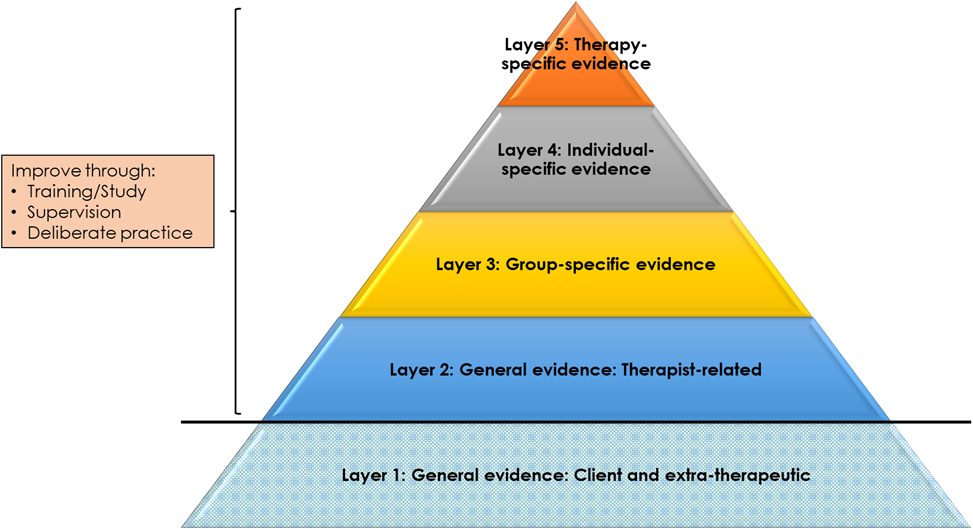
Figure 7. Opportunities to Develop Therapist Competences and Meta-Competences

In fact, Layer 1 probably does also offer opportunities for enhancing the beneficial effects of therapeutic work—perhaps to a great extent—though this is rarely the focus of study or training. Here, emphasis is on how clients might be empowered or enabled to develop skills in using therapy most effectively. A good example would be the ‘resource activation’ work of Christoph Flückiger and colleagues, which invites clients to draw on their own strengths and resources to ‘drive’ the therapeutic process. In addition, this is the layer at which therapists might be developing competences in social and political advocacy practices. Developing the ability, for instance, to challenge unjust organisational policies might help to address the psychological distress brought about by racial discrimination.

Of course, research evidence is not the only sources of guidance on how to practice. Therapists may also draw, for instance, from theory, their own experiences, and from their supervision work. These sources are likely to be interlinked in complex ways, but for simplicity sake we can present them as per Figure 8.

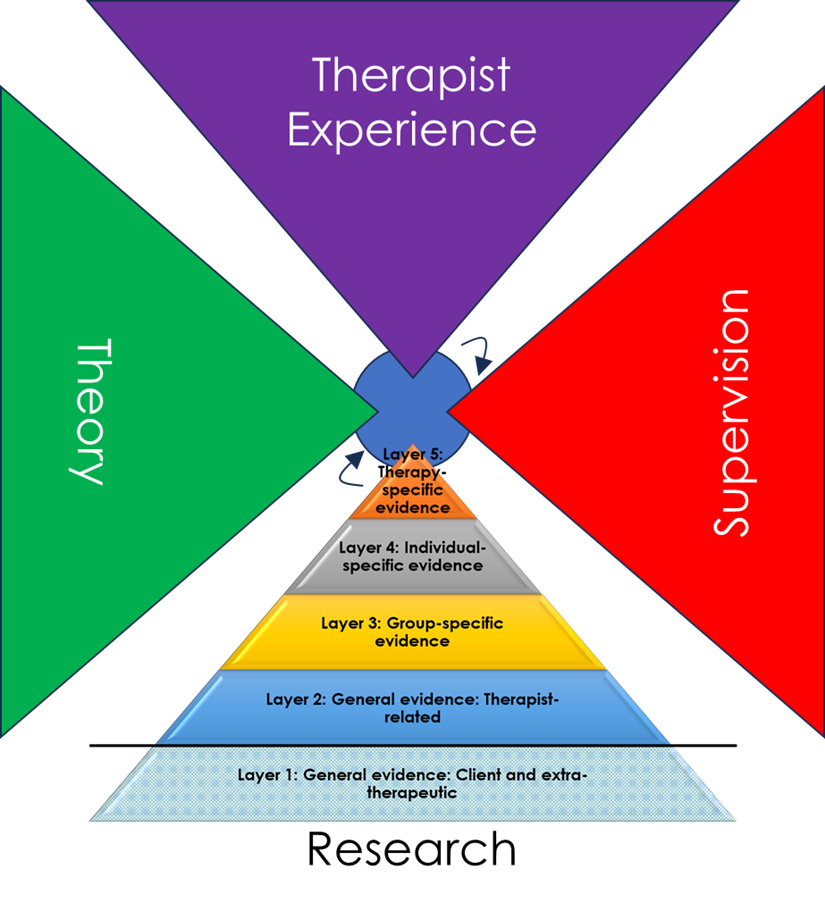
Figure 8. Multiple Sources of Guidance on Practice

And, as with the layers of evidence, different individuals, training programmes, or services may place emphasis on very different sources to guide practice. In NHS Talking Therapies, for instance, practice is primarily based on research evidence (Layer 3, diagnosis-specific) (see Figure 9). By contrast, in much of the counselling field, practice is primarily guided by theory, supervision, and the therapist’s own personal experiences—as well as responsiveness in the specific moment—with research evidence playing only a very minor role (Figure 10).

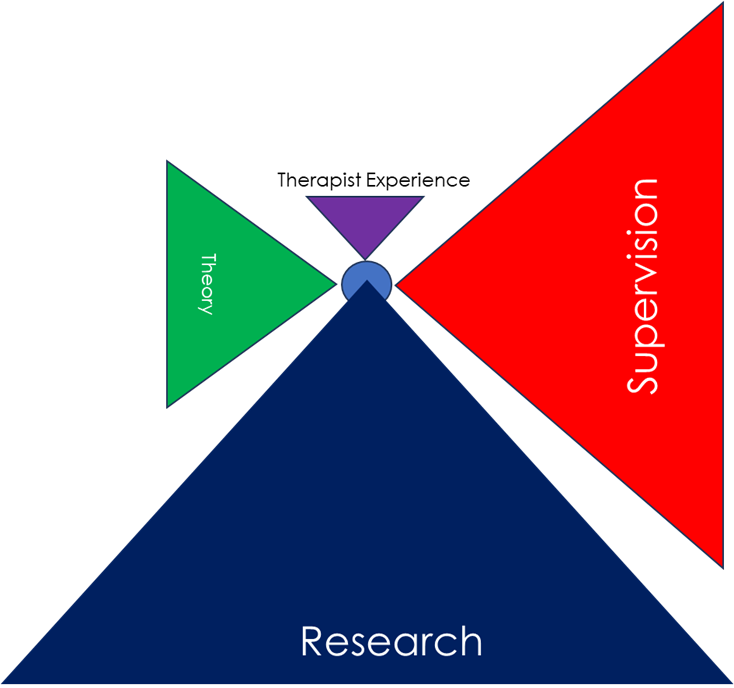
Figure 9. Sources of Practice in NHS Talking Therapies

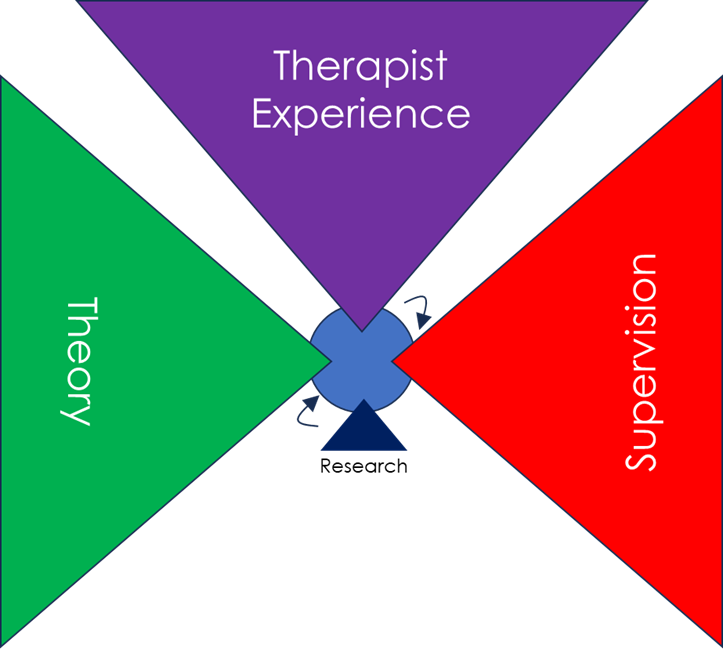
Figure 10. Typical Sources of Practice in the Counselling Field

Again, one might argue that, in best practice, there is an openness to drawing fully from all potential sources.  

This pyramidal framework for drawing on research evidence is very different from the ‘hierarchy of evidence’ as used, for instance, in NICE clinical guidelines. While the latter ranks research according to its ‘objectivity’—placing randomised clinical trials and their meta-analyses at the top and expert opinion at the bottom—the present framework makes no assumptions about the relative worth of different methodologies. Qualitative research, for instance, may be a very powerful means of understanding what particular methods or practices are particularly helpful for particular groups of clients (Layer 3). Indeed, in this framework, the data that may be of most value to particular episodes of therapy—by being most proximal—is individualised ROM data: very different from the kind of generalised RCT data prioritised in the standard hierarchy of evidence.

Conclusions

When trying to make sense of the vast body of psychotherapy research evidence, there are many different ways of organising the research:

  • Different factors (therapist, client, etc)

  • Degree of ‘independence’/rigour of the research (the IAPT/NICE approach)

  • Effective treatments for different problems (again, the the IAPT/NICE approach)

  • Evidence for different therapeutic approaches overall

  • The proximity of the research evidence to the actual client and session (what is being proposed here)

Of course, there is no one right way, and these different organising principles can be combined in a wide variety of ways. For instance, the evidence at each layer of the present framework could then be organised by degree of independence of the research, or by different factors. However, each of these frameworks do prioritise and emphasise, even if implicitly, different elements of the research evidence. In the present one, there is as implicit privileging of data that is most proximal to the client—the ‘top’ of the pyramid. This can be seen as emerging from my own humanistic, existential, and phenomenological ‘ontology’ (theory of being) and ethics, which tends to reject the positivist assumption that the universe acts—and can be understood as acting—according to general, underlying mechanisms and laws. Rather, there is an emphasis here on ‘otherness’ and the irreducibility of human being. That is, that human beings’ lived-experiences can be unique, and that focusing on the unique and distinctive aspects of that experiencing is an important element—both ontologically and ethically—of understanding the whole.

Having said that, as Nicola Blunden points out in her comments below, the approach presented here is therapist-centred, in that it is a framework by which therapists can use the evidence. That is consistent with the target audience of my ‘facts are friendly’ book, but it raises the question of what a client-centred, or relationship-centred framework for making sense of the research findings would look like. Perhaps that would start with a greater focus on, and nuancing of, ‘Layer 1’ evidence: What can the client do with this to maximise their therapeutic outcomes? Nicola also raises the interesting point of whether a pyramid is still too hierarchical: would a target or spiral be a better representation of the potential use of data in therapy?

The pyramidal framework presented here is a way of organising research data to inform therapeutic practice. The pyramid builds, in layers, from the most general to the most specific evidence of what works—and is working—for an individual client. This framework does not negate a more factors-based taxonomy—indeed, it can incorporate it—but emphasises, instead, the relative proximity of different data sources to the actuality of each episode of clinical practice. Perhaps what is most useful about this framework is it provides a means of segueing from general and group-level research to individual-level research—and then, even, on to responsivity in moment-by-moment practice. This may allow a greater integration of research data into practice: research, here, is not something separate from what therapists generally do, but something spread on a continuum from the most general to the most specific. This framework is also a means of representing the way different sources of evidence may be weighted in different approaches, as well as the weighting of research evidence against other sources of clinical guidance. And while this framework does not indicate which sources (research or otherwise) should be prioritised, by mapping out possibilities in this way, it hints at the potential value of all. While this framework is a work in progress, it may be a way of organising and making sense of the research evidence that encourage a broader, more encompassing, and more pluralistic conceptualisation of all its uses.

Measure Development and Testing Research: Some Pointers

Have you ever had one of those dreams where you’re running towards something, and the faster you go the further away it seems to get? That, to me, is what doing research in the measure development field seems like. Every time I think I have mastered the key methods some bright spark seems to have come up with a new procedure or analysis that is de rigueur for publishing in the field. No mind, I have to say that developing measures has been one of the most satisfying and even exhilarating elements of my research career, however humbling it might be at times. And, indeed, having gone from knowing next to nothing about measure development to creating, or helping to test, some fairly well-used measures (including one with my name on it, the Cooper-Norcross Inventory of Preferences!), I’m pretty confident that it’s a research process that anyone—who’s willing to devote the time—can get involved in.

And, of course, the point of developing and validating measures is not just for the narcissistic glory. It’s research that can help to define phenomena and explore their relationship to other factors and processes. Take racial microaggressions in therapy, for instance. Measures can help us see where these are taking place, what’s leading to them, and help us assess methods for reducing their prevalence. Of course, the downside of measures is that they take complex phenomena and reduce them down to de-contextualised, linear variables. But, in doing so, we can examine—over large, representative samples—how these variables relate to others. Do different ethnic groups, for instance, experience different levels of racial microaggressions in therapy? We could use qualitative methods to interview clients of different ethnicities, but comparing their responses and making conclusions is tricky. Suppose, for instance, of the Afro-Caribbean clients, we had four identifying ‘some’ microaggressions, two ‘none’, and three ‘it depended on the therapist’. Then, for the Asian clients, we had two saying, ‘I wasn’t sure’, three saying ‘no’, and two saying, ‘it was worse in the earlier sessions’. And one Jewish client felt that their therapist made an anti-Semitic comment while one didn’t. So who had more or less? By contrast, if Afro-Caribbean clients have an average rating of 3.2 on our 1 to 5 scale of in-therapy racial microaggressions, and Asian clients have an average rating of 4.2, and our statistical analysis show that the likelihood of this difference being due to chance is less than 1 in a 1,000 (see blog on quantitative analysis), then we can say something much more definitive.

From a pluralistic standpoint, then, measure development research—like all research methods—has a particular value at particular points in time: it all depends on the question(s) that we are asking. And while, as we will see, it tends to be based on positivistic assumptions (that there is a real, underlying reality—which we can get closer to knowing through scientific research), it can also be conducted from a more relativist, social constructionist perspective (that no objective ‘reality’ exists, just our constructions of it).

What is Measure Development and testing Research?

Measure development research, as the name suggests, is the development of ‘measures’, ‘scales’, or ‘instruments’ (also known as the field of psychometrics); and measure testing research is assessing those measures quality. Measure development studies will always involve some degree of measuring testing, but you can have measure testing studies that do not develop or alter the original measure.

A measure can be defined as a means of trying to assess ‘the size, capacity, or quantity of something’: for instance, the extent to which clients experience their therapist as empathic, or therapists’ commitment to a spiritual faith. In this sense (and particularly from a positivist standpoint), we can think of psychological measures as a bit like physical measures, for instance rulers or thermometers: tools for determining what’s out there (like the length of things, or their temperature).

Well known examples of measures in the counselling and psychotherapy field are the CORE-OM (Clinical Outcomes in Routine Evaluation – Outcome Measure), which measures clients’ levels of psychological distress; and the Working Alliance Inventory, which measures the strength of therapist-client collaboration and bond. There’s more information on a range of widely used ‘process’ and ‘outcome’ measures for counselling and psychotherapy here.

Measures generally consist of several ‘items’ combined into a composite score. For instance, on the CORE-OM, two of the 34 items are ‘I have felt terribly alone and isolated’ and ‘I have felt like crying’. Respondents are then asked to score such items on a wide range of different scales—for instance, on the CORE-OM, clients are asked to rate the items from 0 (not at all) to 4 (Most or all of the time)—such that a total score can be calculated. Note, in this way, measures are different from ‘questionnaires’, ‘surveys’, or ‘checklists’ that have lots of different items asking about lots of different things. Indeed, as we will see, the ‘combinability’ of items into one, or a few, scales tends to be a defining feature of measures.

A measure can consist of:

  • One scale. An example is the Relational Depth Frequency Scale, which measures the frequency of experiencing relational depth in therapy.

  • Two or more scales. An example is the Cooper-Norcross Inventory of Preferences, which has scales for ‘client preference for warm support vs focused challenge’, and ‘client preference for past focus vs present focus’.

  • Two or more subscales: meaningful in their own rights, but also summable to make a main scale score. An example is the Strengths and Difficulties Questionnaire for children, which has such subscales as ‘peer problems’ and ‘emotional symptoms’, combining together to make a ‘total difficulties’ score.

Generally, A single scale measure or a subscale will have between about four and 10 items. Less than that and the internal consistency starts to become problematic (see below); more than that and the measure may too long to complete, with items that are redundant.

Measures can be designed for completion by therapists, by clients, or by observers. They can also be nomothetic (where everyone completes the same, standardised items), or idiographic (where people develop their own items, for instance on a Goals Form).

Underlying Principles

Most measure development and testing research is underpinned by a set of principles known as classical test theory. These are fairly positivistic, in that they assume that there are certain dimensions out there in the world (known as latent variables) that exist across all members of the population, and are there independent of our constructions of them. So people’s ‘experiencing of racial microaggressions’ is a real thing, just like people’s temperature or the length of their big toe: it’s an actual, existent thing, and the point of our measure is to try and get as close as possible to accurately assessing it.

You might think, ‘If we want to know about clients’ experiences of racial microaggressions in therapy, why don’t we just ask them the question, “To what extent do you experience racial microaggressions in your therapy?”’ The problem is, from a classical test theory perspective, a respondent’s answer (the ‘observed score’) is going to consist of two components. The first component is going to be the part that genuinely reflects their experiencing of microaggressions (the ‘true score’ on the latent variable). But, then, a second part is going to be determined by various random factors that influence how they answer that specific question (the ‘error’). For instance, perhaps the client doesn’t understand the word ‘microaggressions’, or misunderstands it, so that their responses to this particular item don’t wholly reflect the microaggressions that they have experienced. Here, what we might do is to try and minimise that error by asking the question in a range of different ways—for instance, ‘Did your therapist make you feel bad about your race?’ ‘Did your therapist deny your experiences of racism?’—so that the errors start to even out. And that’s essentially what measure development based on classical test theory is all about: developing measures that have as little error as possible, so that they’re evaluating, as accurately as they can, respondents’ true positioning on the latent variable. No one wants a broken thermometer or a wonky ruler and, likewise, a measure of the experiencing of racial microaggressions in therapy that only reflects error variance isn’t much good.

As you can see, all this is based on very positivist assumptions: a ‘true’, underlying (i.e., latent) reality out there in the world; acting according to laws that are true for us all; and with ‘error’ like an uninvited guest that we’re trying to escort out of the party. Not much room for the existence of unpredictability, chaos, or individual uniqueness; or the idea that ‘reality’ is something we construct according to social mores and traditions. Having said that, adopting classical test theory assumptions, for the purposes of measure development, doesn’t mean you have to be a fully-fledged positivist. From a pragmatic standpoint, for instance, you can see measure development as a means of identifying and assessing something of meaning and importance—but whether or not it is something ‘real’ can be considered a mute point. We know, for instance, that there is something like racial microaggressions that can hurt clients and damage the therapeutic relationship, so we can do our best to find ways of assessing it, while also acknowledging the inherent vagaries of whatever we do. And, perhaps, what we call ‘racial microaggressions’ will change over time and vary across cultures and individuals, but that shouldn’t stop us from trying to get some sort of handle on it, so that we can do our best to find out more and intervene.

Developing a measure

So how do you actually go about developing a measure? It might seem like most measures are developed on the back of the proverbial ‘fag packet’ but, OMG, it is vastly more complicated and time-consuming than that. I worked out that, when Gina di Malta (with myself and Chris Evans) developed the 6-item Relational Depth Frequency Scale, it took something like six years! That’s one year per item.

That’s why, for most of us who have developed measures, the first thing we say to people who want to develop their own measures is to first see if they can use measures that are already out there. That’s unless you really have the time and resources to do the work that’s needed to develop and validate your own measure. Bear in mind, a half-validated measure isn’t much valid at all.

So why does it take so long? To a great extent, it’s because there’s a series of stages that you need to go through, detailed below. These aren’t exact, and every measure development study will do them slightly differently, but the sections below should give you a rough idea of what steps a measure development study will take.

Defining the Latent Variable

Before you develop a measure, you have to know what it is that you are trying to measure. To some extent, this may emerge and evolve through your analysis, but the clearer you are about what you’re looking for, the more likely your measure will be fit for finding it.

‘I’d like to know whether clients feel that they’ve got something out of a session.’ OK, great, but what do we mean by ‘got something out of’? Is this feeling that they’ve learnt something, or finding the session worthwhile, or experiencing some kind of progress in their therapy? ‘Maybe all of those things.’ OK, but feeling like you’ve learnt something from a session may not necessarily correlate with feeling like you’ve made progress. They may seem similar, but perhaps some clients feel there’s a lot they’ve learnt while still coming out of a session feeling stuck and hopeless.

Things that just naturally seem to go together in your mind, then, may not do so in the wider world, and disentangling out what you want to focus on is an important starting point for the measure development work. How do you do that? Read the literature in the area, talk to colleagues, journal, look at dictionaries and encyclopaedias: think around the phenomenon—critically—as much as you can. What you want to identify is one discrete variable, or field, that you can really, clearly define. It could be broader (like ‘the extent to which clients value their sessions’) or narrower (like ‘the extent to which clients feel they have developed insight in their sessions’), but be clear about what it is.

item generation

Once you know what latent variable you want to measure, the next step is to generate items that might be suitable for its assessment. At this stage, don’t worry too much if the items are right or not: brainstorm—generate as many items as you can. In fact, one thing I’ve learnt over the years is that you can never have too many items at this stage, and often you can have too few. Probably around 80% or so of items end up getting discarded through the measure development process, so if you want to end up with a scale of around 5-10 items, you probably want to start with around 25-50 potential ones. Bear in mind that you can always drop items if you get to the end of the measure development process and have too many, but it’s much more difficult to generate new items if you get to the end and find you have too few.

Ideally, you want to do this item generation process in one or more systematic ways, so it is not just the first, ad hoc, items that come into your head. Some strategies for generating items are:

  • Search the literature on the topic. Say we wanted to develop a measure to assess the extent to which adolescent clients feel awkward in therapy (we’re interested in differences in awkwardness across types of therapies, and types of clients). So let’s go to Google Scholar to see what papers there are on young people’s awkwardness in therapy, and also we should check the more established psychological search engines like PsychInfo and Web of Science (if we have access, generally through a university). Supposing, there, we find research where young people say things like, ‘I felt really uncomfortable talking to the counsellor’ or ‘The therapist really weirded me out’. So we can use these statements like that (or in modified form) as items for our measure, and it might also trigger some ideas about further items, like ‘I felt really comfortable talking to the counsellor’ (a reverse of the first statement here), or ‘The therapist seemed really weird’ (a modification of the second statement).

  • Interviews and focus groups. Talk to people in the target population to see what terms they use to talk about the phenomena. For instance, an interview with young clients about their experiences of counselling (approved, of course, through the appropriate ethical procedures) might be an ideal way of finding out how they experience ‘awkwardness’ in therapy. What sort of words do they use to talk about it? How does it feel to them?

  • Dictionaries and thesauruses. Always a valuable means of finding different synonyms and antonyms for a phenomena.

Remember, what you are trying to do is to generate a range of items which are, potentially, a means of ‘tapping into’ your latent variable. Have a mixture of phrasings, with some items that are as closely worded to your latent variable as possible (for instance, ‘I felt awkward in therapy’), but other that might come at it from a different angle, providing ‘triangulation’ (for instance, ‘The interaction with my therapist seemed unusual’). It’s also good to try reversing some items (so, for instance, having items that are about not feeling awkward, as well as feeling awkward)—though having such items in a final scale is no longer considered essential.

At this point, you’ll also need to start thinking about your response categories: the ways that people score your items. For instance, do people rate the items on a 3- or 5-point scale, and what labels might you use to describe these different points? This is an enormous field of science in itself, and usually it’s best to keep it simple and use something that’s already out there so that it’s been tried and testing. For instance, if you decide to develop your own four point scale with labels like 1 = Not at all, 2 = A really small amount, 3 = Quite a bit, 4 = Moderately, 5 = Mostly, How do you know that Quite a bit means less to people than Moderately; and couldn’t the difference between 2 and 3 (A really small amount and Quite a bit) be a lot more than the difference between 4 and 5 (Moderately and Mostly)? So have a look at what other validated and well-used measures use as response categories and see if anything there suits. Two common ones are:

  1. = Strongly disagree

  2. = Moderately disagree

  3. = Mildly disagree

  4. = Mildly agree

  5. = Moderately agree

  6. = Strongly agree

    Or

  1. = Not at all

  2. = Only occasionally

  3. = Sometimes

  4. = Often

  5. = Most or all of the time

At this point, you’ll also need some idea of how you phrase the introduction to your measure. Generally, you’ll want to keep it as short as possible, but there may be some essential instructions to give, such as who or what to rate. For instance, for our racial microaggressions measures, we might want to say something like:

Please think of your relationship with your current therapist. To what extent did you experience each of the following?

In this instance, we might also consider it essential to say whether or not the clients’ therapists will see their scores, as this may make a big difference to their responses.

Testing items

Expert Review

The next stage of the measure development process is to pilot test our items. What we would do is to show each of our items to experts in the field (ideally experts by experience, as well as mental health professionals)—say between about 3 and 10 of them—and ask them to rate each of our potential items for how ‘good’ they are. We could do this as a survey questionnaire, on hard copy, or through questionnaire software such as Qualtrics. An example of a standardised set of questions for asking this comes from DeVellis’s brilliant book on scale development. Here, experts can be asked to rate each item on a four-point scale (1 = not at all, 2 = a little, 3 = moderately, and 4 = very well) with respect to three criteria:

  1. How well the item matches the definition of our latent variable (which the experts are provided with)

  2. How well formulated the item is for participants to fill in

  3. How well, overall, the item is suited to the measure

Once the responses are in, those items with the lowest ratings (for instance, with an average < 3) can be discarded, leaving only the most well formulated and suitable items to go forward for further testing and analysis.

Three Step Interviewing Technique

Something else that I’ve learnt, from Joel Vos, that can be really useful for selecting items in these early stages is called The Three-Step Test Interview. This essentially involves asking a few respondents (ideally the kind of people the measure is for) to ‘think aloud’ while completing the measure, and then to answer some interview questions about their experiences and perceptions of completing the measure. This, then, gives us a vivid sense of what the experience of completing the measure is like, and what’s working and what’s not. Through this process, for instance, it might become evident that certain items—even if the experts thought they were OK—don’t make much sense to participants, or are experienced as boring or repetitive. And respondents might also have ideas for how items can be better worded. Again, questions that don’t work well can be removed at this stage and, potentially, new or modified items could be added (though bear in mind they haven’t been through the expert review process).

Exploratory psychometrics

You’re now at the stage of sending your measure out to survey. The number of respondents you need at this stage is another field that is a science in itself. However, standard guidance is a minimum of 10 respondents per item, with other guidance suggesting at least 50 respondents overall if the aim is detect one dimension/scale, and 100 for two (see, for instance, here).

At this point, you almost certainly want to be inviting respondents to complete the measure online: for instance, through Qualtrics or Survey Monkey. Hard copies are an option, but add considerably to the processing burden and, these days, may make prospective participants less likely to respond.

Ideally, you want respondents to be reflective of the people who are actually going to use the measure. For instance, if it’s a measure intended for use with a clinical population, it’s not great if it’s been developed only with undergraduate students or with just your social media contacts. Obviously, too,it’s also important to aim for representativeness across ethnicity/race, gender, age, and other characteristics.

If you’ve got funding, one very good option here can be to use a Mechanical Turk service, such as Prolific. This is, essentially, a site where people get paid to complete questionnaires; and because it’s such a large pool of people, from all over the world, it means you’ve got more chance of recruiting the participants you need. We used this, for instance, to gather data on the reliability and validity of the Cooper-Norcross Inventory of Preferences (see write-up here), and it allowed us to get US and UK samples that were relatively representative in terms of ethnicity, gender, and age—not something we could have easily achieved just by reaching out to our contacts.

Once you’ve got your responses back, you’re on to the statistical analysis. The aim, at this point, is to get to a series of items that can reliably assess one or more latent dimensions, in a way that is as parsimonious as possible (i.e., with the fewest items necessary). This scale shortening process can be done in numerous ways, but one of the most common starting points is to use exploratory factor analysis (EFA).

EFA is a system for identifying the dimension(s) that underlie scores from a series of items. It’s a bit like putting an unknown liquid on a dish and then boiling it off to see what’s left: perhaps there’s crystals of salt, or maybe residues of copper or gold. EFA has to be done using statistical software, like SPSS or R (not Excel), and you need to know what you’re doing and looking for. On a 1-10 scale of difficult stats, it’s probably about a 5: not impossible to pick up but also does require some fair degree of training, particularly if you don’t have a psychology degree. What follows (as with all the stats below) is just a basic overview to give you an idea of the steps that are needed.

The first thing you do in EFA is to see how many dimensions actually underlie your data. For instance, the data from our ‘experiences of racial microaggression’ items may suggest that they are all underpinned by just one dimension: How much or how little people have experienced microaggressions from their therapists. But, alternatively, we may find that there were more latent dimensions underlying our data: for instance, perhaps people varied in how much they experienced microaggressions, but also the degree to which they felt hurt by the microaggressions they experienced. So while some people could have experienced a lot of microaggressions and a lot of hurt, others might have experienced a lot of microaggressions but not much hurt; and any combination across these two variables might be possible.

What EFA also does is to help you see how well different items ‘load’ onto the different dimensions: that is, whether scores on the items correlate well with the latent dimension(s) identified, or whether they are actually independent of all the underpinning dimensions on the measure. That way, it becomes possible to select just those items that reflect the latent dimension well, discarding those that are uncorrelated with what you have actually identified as a latent scale. At this point, it’s also common to discard those items that load onto multiple scales: what you’re wanting is items that are specifically and uniquely tied to particular latent variables. At this point, there’s many other decision rules that can also get used for selecting items. For instance, you might want items that have a good range (i.e., going the full length of the scale), rather than all scores clustering in the higher or lower regions; and the items also need to be meaningful when grouped together. So this process of scale shortening is not just a manualised one, following clearly-defined rules, but a complex, nuanced, and selective art: as much alchemy as it is science.

By the end of this exploratory process, you should have a preliminary set of items for each scale or subscale. And what you’ll then need to do is to look at the items for each scale or subscale and think about what they’re assessing: how will you label this dimension? It may be that the alchemical process leads you back to what you set out to find: a ‘prevalence of racial microaggressions’ dimension, for instance. But perhaps what crystallised out was a range of factors that you hadn’t anticipated. When we conducted our first Cooper-Norcross Inventory of Preferences study, for instance (see here), we didn’t really know what preference dimensions would emerge from it. I thought, for instance, that we might find a ‘therapist directed vs client directed’ dimension, as we did, but I was surprised to see that there was also a ‘focused challenge vs warm support’ dimension emerging as well—I had just assumed that therapist directiveness and challenge were the same thing.

Testing the Measure

As with exploratory measure development, there are numerous methods for testing the psychometric properties of a measure, and procedures for developing and testing measures are often iterative and overlap. For instance, as part of finalising items for a subscale, a researcher may assess the subscale’s internal reliability (see below) and, if problematic, adjust its items. These tests may also be conducted on the same sample that was used for the EFA, or else a new sample of data may be collected with which to assess the measure’s psychometric properties.

Two basic sets of tests exist that most researchers will use at some point in measure development research: the first concerned with the reliability of the measure and the second concerned with its validity.

Basic Reliability Tests

The reliability of a measure is the extent to which it produces consistent, reproducible estimates of an underlying variable. A thermometer, for instance, that gave varied readings from one moment to the next wouldn’t be much use.

  • Internal consistency is probably the most important, and frequently reported, indicator of a scale’s ‘goodness’ (aside from when the measure is idiographic). It refers to the extent that the different items in the scale are all correlating together to measure the same thing. If the internal reliability is low, it means that the items, in fact, are not particularly well associated; if high, it means that they are all aligned. Traditionally, internal consistency was assessed with a statistic called ‘Cronbach’s alpha (α)’, with a score of .7 or higher generally considered adequate. Today, there is increasing use of a statistic called ‘McDonald’s omega (ω)’, which is seen as giving a less biased assessment.

  • Test-retest reliability is very commonly used in field of psychology, but is, perhaps, a little less prevalent in the field of counselling and psychotherapy research, where stability over time is not necessarily assumed or desired. Test-retest reliability refers to the stability of scores over a period of time, where you would expect people to score roughly the same on a measure (particularly if it is a relatively stable trait). If respondents, for instance, had wildly fluctuating scores on a measure of self-esteem from one week to the next, it would suggest that the measure may not be tapping into this underlying characteristic. Test-retest stability is often calculated by simply looking at the correlation of scores from Time 1 to Time 2 (an interval of about two weeks is typically used), though there are more sophisticated statistics for this calculation. Assessing test-retest reliability requires additional data to be collected after the original survey—often with a subset of the original respondents.

  • Inter-rater reliability is used where you have an observer-completed measure. Essentially, if the measure is reliable, then different raters should be giving approximately the same ratings on the scales. In our assessment of an auditing measure for person-centred practice in young people, for instance (see here), we found quite low correlations between how the raters were assessing segments of person-centred practice. That was a problem, because if one rater, on the measure, is saying that the practice is adherent to person-centred competencies, and another is saying it isn’t, then it suggests that the measure isn’t a reliable means of assessing what is and is not a person-centred way of working.

Basic Validity Tests

The validity of a measure is the extent to which it measures the actual thing that it is intended to. Validity can be seen as the ‘outward-facing’ element of a measure (how it relates to what is really going on in the world), whereas reliability can be seen as the ‘inward-facing’ element (how the different parts within it relate together).

  • Convergent validity tends to be the most widely emphasised, and reported, test of validity in the counselling and psychotherapy research field. It refers to the extent that scores on the measure correlate with scores on a well-established measure of a similar construct. Suppose we were developing a measure to assess how prized clients feel by their therapists. No measures of this exact construct exist out there in the field (indeed, if it did, we wouldn’t be doing this work), but there’s almost certainly other scales, subscales, or even individual items out there that we’d expect our measure to correlate with: for instance, the Barrett-Lennard Relationship Inventory’s ‘Level of Regard’ subscale. So we would expect to find relatively high correlations between scores on our new prizing measure and those on the Level of Regard subscale, say around .50 or so. If the correlations were zero, it might suggest that we weren’t really measuring what we thought we were. But bear in mind that correlations can also be too high. For instance, if we found that scores on our prizing measure correlated extremely closely with scores on Level of Regard (> .80 or so), it would suggest that our new measure is pretty redundant: the latent variable we were hoping to tap has already been identified as Level of Regard. Assessing convergent validity means that, in our original survey, we might also want to ask respondents to complete some related measures. That way, we don’t have to do a further round of surveying to be able to assess this psychometric property.

  • Divergent validity is the opposite of convergent validity, and is essentially the degree to which our scale or subscale doesn’t correlate with a dimension that should be unrelated. For instance, our measure of how prized clients feel wouldn’t be expected to correlate against a measure of their degrees of extraversion, or levels of mental wellbeing. If they did, it would suggest that our measure is measuring something other than we think it is. Measures of ‘social desirability’ are good tools to assess divergent validity against because we really don’t want our measure to be associated with how positively people try to present themselves. As with assessing convergent validity, assessing divergent validity means that we may need to add a few more measures to our original survey, if we don’t want to go through a subsequent stage of additional data collection.

  • Structural validity is the degree to which the scores on the measure are an adequate reflection of the dimensions being assessed. EFA, as discussed above, can be used to identify one or more underlying dimensions, but this structure needs validating in further samples. So this means collecting more data (or splitting the original data into ‘exploratory’ and ‘confirmatory’ subsamples), and then the new data can be analysed using a procedure called confirmatory factor analysis (CFA). CFA is a complex statistical process (about a 9 on the 1-10 scale), but it essentially involves testing whether the new data fits to our ‘model’ of the measure (i.e., its hypothesised latent dimension(s) and associated items). CFA is a highly rigorous check of a measure, and it’s a procedure that’s pretty much essential now if you want to publish a measure development study in one of the higher impact journals.

  • Sensitivity to intervention effects is specific to outcome measures, and refers to the question of whether or not the measure picks up on changes brought about by therapy. We know that therapy, overall, has positive benefits, so if scores on a measure do not show any change from beginning to end of intervention, it suggests that the measure is not a particularly valid indicator of mental wellbeing or distress. To assess this sensitivity, we need to use the measure at two time points with clients in therapy: ideally at the start (baseline) and at the end (endpoint). Measures that show more change may be particularly useful for assessing therapeutic effects. For instance, in our psychometric analysis of a goal-setting measure for young people (the Goal Based Outcome Tool), we found that this measure indicated around 80% of the young people had improved in therapy, as compared with 30% for the YP-CORE measure of psychological distress.

Advanced Testing

…And there’s more. That’s just some of the basic psychometric tests and, like I said earlier, there seems to be new ones to catch up with everyday, with numerous journals and books on the topic. For instance, testing for ‘measurement invariance’ seems to becoming increasingly dominant in the field, which uses complex statistical processes to look at whether the psychometrics of the measures are consistent across different groups, times, and contexts (this is about a 15 out of 10 for me!). And then there’s ‘Rasch analysis’ (see here), which uses another set of complex statistical procedures to explore the ways that respondents are scoring items (for instance, is the gap between a score of ‘1’ and ‘2’ on a 1-5 scale the same as the gap between ‘3’ and ‘4’?). So if you’re wanting to publish a measure development study in the highest impact journals, you’ll almost certainly need to have a statistician—if not a psychometrician—on board with you, if you’re not one already.

Developing benchmarks

Once you’ve got a reliable and valid measure, you may want to think about developing ‘benchmarks’ or ‘cutpoints’, so that people know how to interpret the scores from it. This can be particularly important when you’re developing a clinical outcome measure. Letting a client know, for instance, that they’ve got a score of ‘16’ on the PHQ-9 measure of depression, in itself, doesn’t tell them too much; letting them know that this is in the range of ‘moderately severe depression’ means a lot more.

There’s no one way of defining or making benchmarks. For mental health outcome measures, however, what’s often established is a clinical cut-off point (which distinguishes between those who can be defined as being in a ‘clinical range’ and those in a ‘non-clinical range’); and a measure of reliable change, which indicates how much someone has to change on a measure for it to be unlikely that this is just due to chance variations. For instance, on the Young Person’s CORE measure of psychological distress, where scores can vary from 0 to 40, we established a clinical cut-off point of 10.3 for males in the 11-13 age range, and a reliable change index of 8.3 points (see here). The calculations for these benchmark statistics are relatively complex, but there are some online sites which can help, such as here. You can also set benchmarks very simply: for instance, for our Cooper-Norcross Inventory of Preferences, we used scores for the top 25% and bottom 25% on each dimension as the basis for establishing cut-off points for ‘strong preferences’ in both ways.

the Public domain

Once it’s all finalised and you’re happy with your measure, you still need to think about how you’re going to let others know about it. There’s some journals that specifically focus on the development of measures, like Assessment, though they’re by no means easy to get published in. Most counselling and psychotherapy journals, though, will publish measure development studies in the therapy field, and that puts your measure out into the wider public domain.

At this stage you’ll also need to finalise a name for your measure—and also an acronym. In my experience, the latter often ends up being the toughest part of the measure development process, though sites like Acronymify can help you work out what the options might be. Generally, you want a title that is clear and specific to what your measure is trying to do; and a catchy, easy-to-pronounce acronym. If the acronym actually means or sounds something like what the measure is about—like ‘CORE’—that’s even better.

If there’s any complexities or caveats to the measure at all in terms of its use in research or clinical practice, it’s good to produce really clear guidelines for those who want to use it. Even a page or so can be helpful and minimise any ambiguities or potential problems with its application. Here is an an example of the instructions we produced for our Goals Form.

It can also be great to develop a website where people can access the measure, its instructions, and any translations. You can see an example of this for our C-NIP website here.

Regarding translations, its important that people who may want to translate your measure follow a standardised procedure, so that it stays as consistent as possible with the original measure. For instance, a standard process is to ‘back translate’ an initial draft translation of the measure to check that the items are still meaning the same thing.

In terms of copyright, you can look at charging for use of the measure, but personally I think it’s great if people can make these freely available for non-commercial use. But to protect the measure from people amending it (and you really don’t want people doing their own modifications of your measure) you can use one of the Creative Commons licenses. With the measures I’ve been involved with, we’ve used ‘© licensed under the Creative Commons Attribution-NonCommercial-NoDerivatives 4.0 International (CC BY-NC-ND 4.0)’ so that others can use it freely, but can’t change it or make money from its use (for instance, by putting it on their own website and then charging people to use it).

Conclusion

At the most advanced levels, measure development and testing studies can be bewildering. Indeed, even at the most basic level they can be bewildering—particularly for those who are unfamiliar with statistics. But don’t let that put you off. There’s a lot of the basic item generation and testing that you can do without knowing complex stats, and if you’re based at an institution there’s generally someone you can ask to help you with the harder stuff. There’s also loads of information that you can google. And what you get at the end of it is a way of operationalising something that may be of real importance to you: creating a tool which others can use to develop knowledge in this field. So although measure development research can feel hard, and like a glacially slow process at times, you’re creating something that can really help build up understandings in a particular area—and with that the potential to develop methods and interventions that can make a real difference to people’s lives.

Acknowledgements

Photo by Tran Mau Tri Tam ✪ on UnsplashDisclaimer

 The information, materials, opinions or other content (collectively Content) contained in this blog have been prepared for general information purposes. Whilst I’ve endeavoured to ensure the Content is current and accurate, the Content in this blog is not intended to constitute professional advice and should not be relied on or treated as a substitute for specific advice relevant to particular circumstances. That means that I am not responsible for, nor will be liable for any losses incurred as a result of anyone relying on the Content contained in this blog, on this website, or any external internet sites referenced in or linked in this blog.